Statistical Process Control in a Nutshell
Statistical Process Control (SPC) is a powerful framework for data-driven quality improvement.
At is core, SPC involves the plotting of data over time to detect unusual patterns or variations that might indicate a change or problem with a process.
Central to SPC is the distinction between two types of variation in processes: common cause variation and special cause variation.
Common cause variation: Also called natural or random variation. Intrinsic to the process, this variation is stable and predictable within a given range. Addressing it requires changing a major portion of the process.
Special cause variation: Also called a signal or non-random variation. Arising from external factors, this variation is unstable and unpredictable and therefore calls for further investigation to find the underlying cause. The appropriate response depends on whether the variation is beneficial or harmful.
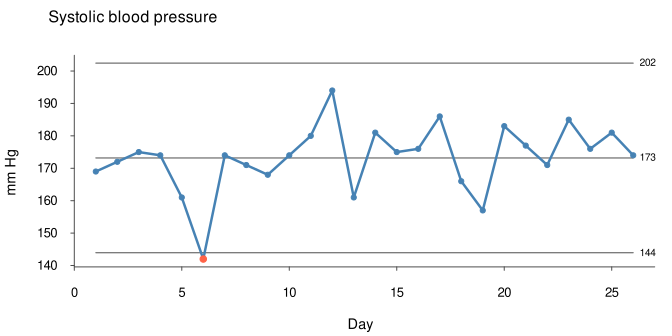
As demonstrated above, SPC charts – also known as control charts or process behaviour charts – plot data points over time. When a process shows only common cause variation, the points scatter randomly around the process centre, typically expressed by the mean or median, and almost all fall within limits that reflect the natural variation of the process. Points outside these limits, or the presence of unusual or non-random patterns within them, suggest special cause variation and should be investigated further with the aim of learning and improvement.
The exact procedures for calculating natural process limits – also known as control limits – are explained in detail in our book and in our SPC charts with R workshop.
However, SPC is much more than just plotting and analysing SPC charts.
SPC is about the continual improvement of processes and outcomes. And it is first and foremost a way of thinking with some tools attached.
– Don Wheeler in Understanding Variation, p. 152
It is our goal to bring both this way of thinking and the tools to healthcare.